

Recent Testing
Direct Mail testing update
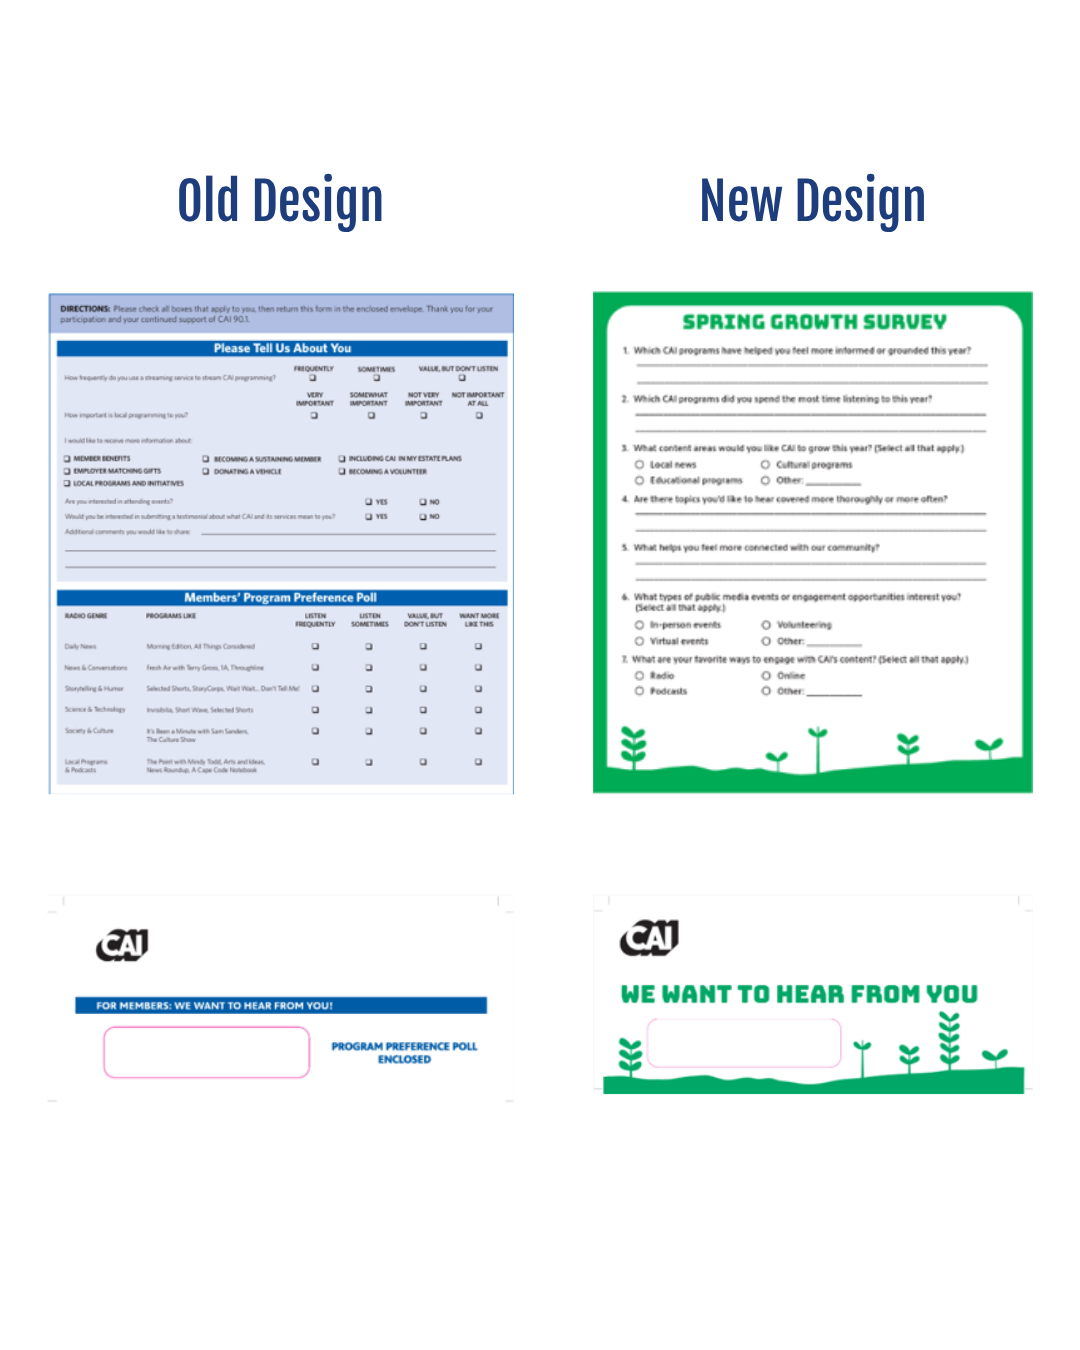
In March 2026, MSB Direct Mail sent a refreshed Spring Survey to Add Gift and Sustainer audiences. The new Spring Survey featured shorter copy with a focus on hopeful language and a theme of springtime “growth.” The artwork is more visually appealing, with a bright and colorful design featuring spring imagery. The survey questions included more free-text response options and a positive tone focused on community.
The refreshed OE is colorful and stands out in the mailbox, which we hoped would encourage more donors to open the letter.
Typically, we mail a Survey package bi-annually in the fall and spring. The previous Survey was more muted and serious, with less visual interest. We suspected that sending a fresh, hopeful, season-specific package would increase the additional gift responses and average gift.
Typically, we mail a Survey package bi-annually in the fall and spring. The previous Survey was more muted and serious, with less visual interest. We suspected that sending a fresh, hopeful, season-specific package would increase the additional gift responses and average gift.
Based on the results we’ve seen so far, our hypothesis was correct. We saw a 1.18% year-over-year increase in response rate from those who received the refreshed FY26 Spring Survey compared to those who received the FY25 Spring Survey. These findings are affirming and wonderful to see! Donors seem to be engaging well with bold, fresh mail solicitations. As such, MSB Direct Mail plans to use these learnings and roll out more creative-based tests in the new fiscal year.
Testing Archive
-
A/B Tests: Passport $8/$96 Minimum Amounts
PBS recently announced a recommendation to raise the minimum donation amount for Passport access to $8/monthly and $96/one-time — a 60% increase from the current $5/monthly and $60/one-time levels. To review the potential impacts of this change, we conducted four A/B tests across participating stations’ Passport pages. All tests implemented the higher $8/$96 minimum amount. We also examined how this increased minimum is affected by different initial and modified ask-array amounts. The ask-array details for each test are fully described in the results section.
Aside from these A/B tests, one station fully implemented the increased $8/$96 Passport minimum in February 2026. Using this real-world data, we reviewed the number of new Passport-acquired donors specifically for the month of February from recent years. We then compared their performance against aggregated data from all other Member Services Bureau (MSB) stations. These findings are included in a separate results section later in this document.
A/B Testing Results
When reviewing this data, please note:
Monthly Sustainers: The one‑year revenue estimates assume that all donors continue their monthly donation for all 12 months (i.e., no cancellations).
Annual Sustainers: Due to the limited number of conversions for annual sustainers, only the revenue estimates are provided.
Probability to Outperform Control Group: For the conversion rate and average donation amount per session metrics, our testing platform calculates the probability that the Variant Group will outperform the Control Group. A 50% value is completely neutral/indecisive.
Donation Amount Per Session: Our testing platform calculates this metric by adding all the recorded donation amounts and dividing by the number of test sessions. A visitor that didn’t donate during their session is counted as $0.
As previously noted, all tests include an increase in the “Other” minimum to $8/$96. However, there are differences in the existing and modified ask-array amounts:
Station #1 and Station #2: Each test is similar in setup. The Control Group’s ask-array options start at $10/monthly and $75/one-time. The Variant Group only increased the $75/one-time to $96 to meet the required minimum.
Station #3: The Control Group’s ask-array starts at $10/monthly and $120/one-time. The Variant Group lowersthese initial amounts to $8/monthly and $96/one-time to meet the minimum.
Station #4: This Control Group’s ask array is unique because they use a lower $6/monthly option with $75/one-time. The Variant Group increases these amounts to $8/monthly and $96/one-time to meet the minimum.
Station #1 Test
Conversion Rate: The Variant Group’s ($8/$96 minimum) conversion rate declined significantly across all donation types. In the combined data, this drop was over 7 percentage points.
Donation Amount Per Conversion: The Variant Group’s ($8/$96 minimum) average donation amount per conversion increased for one-time and monthly donations, as expected due to the higher required amounts.
Revenue: Due to the sharp decline in conversion rates, the Variant Group ($8/$96 minimum) generated less revenue per session than the Control Group for all donation types. This difference was minor for monthly but highly significant for one-time and annual donations. For one-year revenue on the Passport page, the Variant Group ($8/$96 minimum) is estimated to generate about $157,000 less than the Control Group.
Station #2 Test
Conversion Rate: The Variant Group’s ($8/$96 minimum) conversion rate had a severe decline of about 9.5 percentage points overall.
Donation Amount Per Conversion: The Variant Group’s ($8/$96 minimum) average donation amount per conversion increased, as expected.
Revenue: For one-year revenue on the Passport page, the Variant Group ($8/$96 minimum) is estimated to generate about $15,000 less than the Control Group. Revenue was substantially down for annual donations, slightly up for one-time and slightly down for monthly.
Station #3 Test
Conversion Rate: Overall, the Variant Group ($8/$96 minimum) had a slightly higher conversion rate. However, the increase was only 0.22 percentage points with an indecisive probability in the mid-50% range.
Donation Amount Per Conversion: The Variant Group’s ($8/$96 minimum) average donation amount per conversion dropped heavily for one-time types but improved slightly for monthly types.
Revenue: For one-year revenue on the Passport page, the Variant Group ($8/$96 min) is estimated to generate about $24,000 less than the Control Group. The Variant Group’s ($8/$96 min) estimated revenue improved slightly for monthly donations but declined for one-time and annual donations.
In this test, the initial ask-array amounts were lowered, which is an additional factor aside from the increased “Other” minimum. The ask-array changes may be helping to improve conversion rates but may also be reducing the amount per conversion.
Station #4 Test
Conversion Rate: The Variant Group’s ($8/$96 minimum) overall conversion rate declined 3.65 percentage points with a nearly 100% probability estimate. The conversion rate decreased for both one-time and monthly donations.
Donation Amounts Per Conversion: The Variant Group’s ($8/$96 minimum) average donation amount per conversion increased across all donation types, as expected due to the higher “Other” minimum and increased ask-array amounts.
Revenue: For projected one-year revenue, the Variant Group ($8/$96 minimum) is estimated to generate about $55,000 more than the Control Group. The Variant Group’s ($8/$96 min) revenue significantly outperformed for monthly donations but declined slightly for one-time.
Results: Existing $8/$96 Implementation
In February 2026, one station adopted the increased $8/$96 Passport minimum without A/B testing. We reviewed the growth in new Passport-acquired donors for the single month of February across recent years. Using this February-only data, we then compared the $8/$96 station’s performance against the aggregated results from all other MSB stations.
The $8/$96 station had a 2.6% increase in new Passport-acquired donors in February 2026 over February 2025, as compared to the dramatic 35% increase for MSB stations over this same period.
Recommendation
It’s important to preface discussion by noting that each station’s customer base may respond differently to price increases based on a variety of factors. However, the data we’ve received in these four A/B tests provides a good basis given the testing limitations.
The results strongly indicate that increasing the minimum amount to $8/month and $96/one-time (from $5/$60) decreases conversion rates. In three of the four tests, the Variant Group’s ($8/$96 min) conversion rates dropped significantly. In percentage points, these declines were 7.55% (Station #1), 9.55% (Station #2), and 3.65% (Station #4) — each with nearly 100% probability predictions.
Station #3 was the only test to show a very slight increase of 0.22 percentage points in overall conversion rate. However, the probability prediction for this result is in the mid-50% range, which is very indecisive. Station #3 was also the only test with a Variant Group ($8/$96 minimum) that lowered the first ask-array options to $8/month and $96/one-time from $10/month and $120/one-time. It’s possible that these lower ask-array options helped to mitigate the negative impacts on conversion rate caused by increasing the “Other” field minimum. But this change may have caused a significant drop in amount per conversion for one-time donations. The result was a decline in overall projected revenue for the Variant Group ($8/$96 minimum).
The Variant Group ($8/$96 minimum) did increase the donation amount per conversion in all the tests except for Station #3 (as discussed earlier). This is not surprising considering the higher required amounts. But that only includes people who donated. The revenue projections are needed to take into account both the conversion rate and amount per conversion. For three of the four tests, the Variant Groups ($8/$96 minimum) had lower projected yearly revenue — with declines of approximately $157,000 (Station #1), $15,000 (Station #2), and $24,000 (Station #3). The increased donation amount averages were not enough to offset the conversion rate declines. Station #4 is the only exception.
Of note, Station #4 has the only Control Group that begins their ask-array with the combination of $6/month — which appears to be on the low end for stations — and $75/one-time. These were increased to meet the required minimum in the Variant Group ($8/$96 min). In the yearly revenue forecast, their Variant Group ($8/$96 min) had an estimated increase of $55,000 — despite the 3.65 percentage point decrease in overall conversion rate. It underperformed by over $6,000 for one-time donations but generated significantly more revenue for monthly donations. This revenue increase is promising. However, this result appears to be an outlier considering that the other three tests showed revenue declines. It’s unclear how much of this revenue increase is due to raising the first ask-array option from $6/month to the more common $8/month, or from increasing the minimum amount in the “Other” field as well.
Separate from the A/B tests, the station that fully implemented the $8/$96 Passport minimum showed lower growth in new Passport‑acquired donors during February. This $8/$96 update occurred in February 2026. Looking specifically at the single month of February each year, the $8/$96 station saw only a 2.6% increase in February 2026 vs. February 2025, compared with a 35% increase for the combined MSB cohort.
Based on these results, we don’t recommend that stations increase their minimum Passport donation amounts to $8/monthly and $96/one-time. The overall trend of declining conversion rates is particularly concerning. We’re considering retesting a smaller increase to this minimum amount. For Station #4 in particular, we recommend that additional testing also includes increasing the initial ask-array options. We’re interested in whether raising the $6/month ask-array option to $8 or higher might increase revenue with minimal impact on conversion rates.
-
3% Processing Fee Checkbox (Donation Form)
For about eight months, we ran an A/B test for a station to review the impacts of adding a 3% processing fee checkbox to their Passport donation page. This checkbox was unchecked by default, optional and set right above the submit button. When selected, this checkbox added the 3% fee to the donation amount. Half of visitors were shown the fee checkbox as the Variant Group, while the Control Group saw no changes/checkbox.
We initially expected that adding this 3% fee checkbox would lower the conversion rate but increase the average donation amount to some extent. However, the Variant Group (with the 3% fee checkbox) performed worse for both metrics: The conversion rate dropped 0.7% while the average donation amount, which calculates the 3% fee when selected, dropped $2.08. Over half of the Variant Group visitors opted to include the 3% fee, yet the donation revenue still declined.
Last year, we ran a similar processing fee test for another station. Overall, the results were inconclusive. The processing fee version was down about 1% for CR%. These results never reached high statistical significance, and we observed fluctuations in CR% performance throughout the testing period.
Based on the A/B tests we’ve conducted so far, we don’t recommend adding the 3% processing fee checkbox to the donation forms at this time. However, we intend to retest this with additional stations before reaching a more definitive conclusion. The full results of this latest test are included below.
** Please note that the 3% processing fee is included in the average donation amount values for the Variant Group (with 3% fee checkbox).
Sessions
Conversion Rate
Total Conversion
Avg. Donation Amount Per Conversion
Avg. Donation Amount Per Test Session
Control Group
(No Fee Checkbox)3,55828.13%1,001$40.31$11.34
Variant Group
(3% Fee Checkbox)3,66827.43%1,006
(584 selected the 3% processing fee option)$38.23$10.49 -
Comment Box Field (Donation Form)
For the donation forms, we recently tested removing an optional comment box field that asked users why they’re supporting the station — and the results were quite dramatic. We ran this test for one station on their main donation and Passport pages. On both pages, visitors with the comment box removed (i.e., Variant Groups) had a significantly higher conversion rate and generated more revenue. The Variant Groups (with removed comment box) had a conversion rate increase of 2.41% on the Passport pages and 0.61% on the main donation pages. This roughly falls in line with our estimates that additional fields may lower conversion rates by about 1% on average. We generally recommend avoiding extra form fields such as this.
It's possible that this comment box field — although optional — may have deterred conversions because it makes the form longer. Users may also be unsure of what to say but feel obligated to include something. This additional mental effort may be causing users to abandon the form. Based on these results, this comment box was removed at the station’s request.
-
December Testing and Optimization Update
Last month, we shared that we’re beginning a systemwide test of new Passport ask amounts, shifting to $8 monthly and $96 for one-time gifts. One version of this test is already live, and a second is about to launch. Several stations are already participating, and we’re still looking for more. If your station is interested in joining, reach out to your CS rep. We’ll bring you updates on the Passport test results as soon as we have actionable data.
Email Test: Larger Font Size
We also wrapped up an email test focused on a deceptively simple adjustment: increasing the font size for desktop and tablet readers to match the larger mobile standard already in use. The goal was to improve readability and see whether a cleaner visual experience would translate into stronger performance.
Across 42 PMOs, it clearly did. The larger-font version drove a revenue increase of about 64% over the control and lifted average gift by more than 70%. These gains show that a clearer, easier-to-read email directly improved donor response and action.
Given the strength of these initial results, we’re planning a follow-up test shortly to confirm the findings across an additional set of sends. Once that confirmation test is complete, we’ll determine whether to standardize this change systemwide.
More updates to come as we gather new data from both the font-size experiment and the Passport ask-amount test.
-
Address Autocomplete (Donation Page)
We recently concluded a donation page A/B test that focused on an address autocomplete feature. This feature suggested full addresses in a dropdown (below the street address field) as the user typed and filled in the address fields. This test ran for over three months and targeted one station’s main donation page.
An address autocomplete feature is used to help with faster form completion, reduce address errors and provide a better overall user experience. For this test, we considered conversion rate to be the primary metric.
Based on test data from over 22,000 visitors, we’re pleased to announce that the address autocomplete version resulted in a higher conversion rate (12.59% vs. 12.22% without it). CDP is happy with these test results and will likely be rolling this feature out to stations in the near future.
Upcoming Tests
We’re in the process of building and coordinating tests related to changing the Passport form’s ask amounts to $8 (monthly) and $96 (one-time). We intend to cover various scenarios, including with and without changes to “other” minimum amount — and different initial amounts. Metrics will include conversion rate, average donation amounts and details on donation frequency type. These tests will help determine if this is something we should pursue.
-
Donation Page Redesign
In late April, we began testing extensive redesigns of our donation pages. In total, we ran five tests for three stations and targeted a mix of the main donation and Passport pages. Prior to running these tests, we consulted with the Evolv testing team. They noted that it’s rare for an extensive redesign to outperform the existing (Control) version, which makes the positive results we’ve seen even more exciting!
For the new design, two variant versions were tested. The first variant (the 1-step New Layout version) showed the entire donation form at once. The second variant (the 2-step New Layout version) required a donor to select a donation amount before completing the form. Both variants featured larger images, form fields and text. They also had the form and body text set side-by-side to bring the form higher into view. Similar images were also added to the existing pages (Control versions) for consistency.
The results varied for each test. However, when combining all the results (for tests with sufficient traffic), the 1-step New Layout version generated the highest average donation amount at $66.75, as compared to $64.51(Control) and $51.83 (2-step New Layout version).
The 1-step New Layout version also generated the highest average donation amount per test session at $8.99, as compared to $8.77 (Control) and $7.84 (2-step New Layout version). The average donation amount per session is calculated by dividing the total donation amount by total sessions. A single session may last multiple days. If a user doesn’t donate/convert during their session, it’s counted as $0 towards the session average.These combined results are consistent with the individual tests that received the most traffic. In the first test to receive sufficient traffic, the Control (Existing Layout) and 1-step New Layout version performed similarly for conversion rate, while the 2-step New Layout version lagged further behind. These results prompted us to revise and retest with the following changes:
Reduced height of new layout image version, to bring the form more into view.
Removed the 2-step New Layout version due to worse performance.
Made the 1-step New Layout version the “Control” version on the original page URL, while the Existing Layout became the redirect variant. Our hypothesis for this change is that the extensive redesign combined with the redirect URL (needed for test setup) caused hesitancy for visitors.
In this retest, the 1-step New Layout version significantly outperformed on all metrics. The 1-step New Layout version showed a 36% increase in donation amount per visitor session ($10.05 vs. $7.39 for Control) and a higher conversion rate (10.14% vs. 9.25% for Control). As mentioned earlier, the Evolv team noted that significant redesigns often perform worse than the existing (Control) versions, which makes these positive results all the more significant.
Stay tuned for rollout details about the donation page redesign soon!
-
Email 1 – Local Programs Test (One PMO)
We wanted to see if calling out local programs would lift response compared with a more general “support community and programming” message. In practice, our treatment listed a few specific local shows for the test station, while the control stayed general and didn’t name any programs. So what we really tested was specific programs named vs. no programs named. Opens were basically the same. The version that named programs pulled a small click bump (about one-tenth of a point), about 25% more gifts, about 50% more total revenue and a higher average gift. So specific programs seem to help. Because we blurred “local” vs. “specific” this round, we’re lining up follow‑ups: (1) mix national/local specific programs vs. none, and (2) local specifics vs. national/flagship specific programs.
Email 2 – Micro‑Donation Ask: $5 Friday vs. $15 Friday (Two PMOs)
Delivery, opens and clicks were basically a tie, so the conversions carried the day, data wise. The $5 Friday version brought in about 20% more gifts and about 25% more revenue overall. Average gift actually landed a bit higher in the $5 version. People often gave more than the floor, so lower ask equaled more donors and no drop in dollars per donor. Clear win for the $5 hook in this test.
Quick note: broader conversion/testing work on the new design donation form is still underway — we’ll share more as results come in.
-
Web: Results
Annual Sustainer / One-time Auto Renew
We recently concluded our second test related to adding an annual sustainer opt-in checkbox to a donation page. This test showed a minor improvement in revenue with an increased average donation amount per conversion and test session, confirming the earlier test results. Notably, these revenue results don’t factor in the added lifetime value that annual sustainers provide.
We encourage all stations to reach out to their client service representative and have the annual sustainer option enabled!
Donation Banner with Recent Donor Details
When reviewing other donation pages, we noticed a few that showed a recent donor’s first name, donation amount and city on the page — in various ways — to encourage conversions. We tested this by including that text and the station’s logo in a banner that was fixed in place at the bottom of the page and always in view. The results weren’t statistically significant but showed a minor drop in revenue. As such, we’re not pursuing this particular design but may re-test other types of designs and content.
-
Web: Annual Sustainer / One-time Auto Renew
For approximately six months and, over 14,000 visitors, we ran a donation page test that assessed the impact of adding an annual sustainer checkbox option under the one-time donation option. The results show that the users offered the annual sustainer option have a slightly higher conversion rate of 19.55%, as compared to 19.41% for users not shown the option. The conversion rate difference is not highly statistically significant, but it’s important to consider the added lifetime value of annual sustainers.
New Tests
We’ve recently engaged in new donation page tests that will review the effects of a completely redesigned page layout and restyled form elements. Each test also includes versions that display the form as either a single-step or multi-step – with the donation amount as the initial step. This test entails some of our most extensive design updates to date. We plan to extend this layout test to additional stations.
-
Web: Shortened Text on Passport Donation Page
On a client’s Passport donation page, we recently concluded a test that showed streamlined, shortened text dramatically improved conversion rates as compared to longer, multi-paragraph text. This test ran from June of 2024 until late in February 2025 and included over 16,000 test visitors. The control version consisted of the original text, with a heading and three paragraphs above the form. The variant version retained the heading but shortened the text to only a single sentence.
The results were highly statistically significant. For conversion rate, the variant version’s shortened text outperformed the control by 2.59%. If estimating revenue over a one-year period, it can be expected that a page only showing the variant version would result in approximately $30,000 more revenue than the control version.
Web: Increased Donation Amounts for Ask Array Options
For roughly five months, we ran a test on a client’s main donation page that modified the ask array’s donation amounts with higher average values. This test was conducted to determine whether the increased donation amounts would result in higher total donation revenue, while also reviewing its impacts on conversion rates and average donation values.
The control version, which has lower “ask array” amounts, outperformed the variant version for overall conversion rate and, rather surprisingly, also outperformed average donation amount per conversion — despite the lower ask array options. Based on these results, the page’s ask array amounts were not modified.
For reference, the control version’s ask array consisted of the following donation amounts:
One-time Amounts: $75.00; $100.00; $250.00; $500.00; $1,200.00.
Monthly Amounts:$10.00; $25.00; $42.00; $100.00.
The variant version’s ask array had higher average donation amounts:
One-time Amounts: $100.00; $250.00; $500.00; $1,200.00.
Monthly Amounts: $15.00; $30.00; $50.00; $100.00.