
Fundraising in Crisis June 2020

Even in normal times, predicting donor behavior is an inexact science. Given the unprecedented nature of today’s crisis, the task of fundraising analysis is all the greater. We looked at 122 Public Broadcasting stations representing nearly $125M in giving during the first 4 months of 2020.
Our station cohort was roughly aligned with the country as a whole, with 61% small stations (under 15,000 members), 28% medium (15,000-40,000 members) and 11% large (40,000+ members). There were 44 radio stations and 79 TV stations represented.
We looked at giving through the first 4 months of 2020 compared to the same period in 2019. We then focused on giving during March and April 2020 compared to March and April 2019 given that these were the first 2 months to feel the impact of the Covid19 crisis.
It should be noted that two months of crisis giving does not predict future giving in such unprecedented times but it does offer a glimpse into impact and hopefully provides some insight into future direction.
Revenue Impact:

In aggregate, our cohort of 142 stations realized a 5.3% increase in overall revenue during the first 4 months of 2020 compared to the same period in 2019. However, strong revenue results in January and February (up 9% over 2019) were behind part of this as March revenue declined 0.6% with April coming in strong showing an 8.8% increase. While it is interesting to look at the total change in revenue across all stations, looking at the median % change in revenue in each individual cohort offers more insight into how different station types were impacted by the crisis.
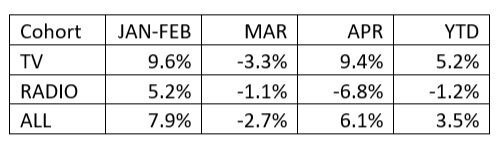
Table 1 below represents the median percent change during the period for each cohort. While the overall median increase for the first 4 months of 2020 shows an increase of 3.5%, the data indicates that TV stations were up more for the period than radio. This appears to be largely driven by a much stronger April for TV stations relative to radio stations.
Direct Mail:
On average 30% of station revenue came in via the mail (renewals, acquisition, lapsed, add-gift) during the first 4 months of the year. TV stations showed a median 1.4% increase after a strong April while radio stations showed a 5.3% median increase for the same period.
Pledge:

While Pledge represented about 20% of total membership revenue for the 4-month period, the month of March is a particularly strong pledge month constituting an average 31% of monthly revenue. It was clear in the data that some stations appeared to pull back from pledge during March 2020. However, most stations appear to have continued March pledge during the crisis with reasonably good results. Radio pledge may have been hurt by the shelter-in-place directive as pledge revenue dropped a median 11% in March and 28.7% in April perhaps as less donors found themselves tuning in while commuting to work. TV pledge suffered less of a loss, dropping 4.9% in March and 4.6% in April ending the 4-month period down a median 4.7%.
Sustainers:
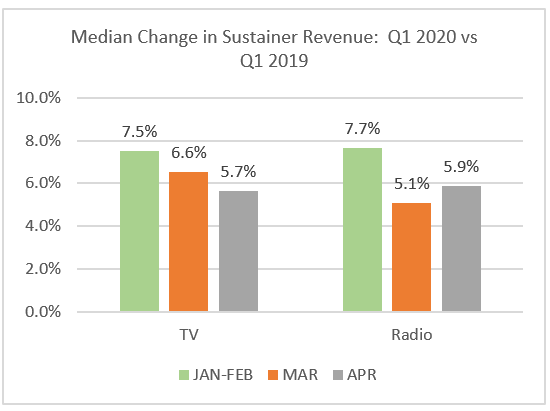
No group in this analysis had a greater impact on the success of stations than sustainers. Representing an average 24% of all membership revenue for the period, sustainer revenue was one of the few segments showing positive gains in all 3 periods. Both TV and Radio showed solid gains of over 5% for both March and April. Overall, ror the first 4 months of the year TV stations were slightly higher at 6.9% compared to Radio at 6.4%.
Digital:
Many donors appear to have responded to crisis-related Digital messaging. Digital revenue, excluding Passport, was up in both March and April. While Digital revenue only makes up 7-8% of membership revenue, it accounted for 11.4% of total revenue in April across stations in our analysis. For the 4-month period, radio was up a whopping 29.8% while TV stations were up 28.8%, driven by strong fundraising in March and April. Station’s ability to pivot messaging and quickly connect to donors during a crisis are critical differentiators for this fundraising segment.
Passport:

Passport revenue was split out from Digital for the purposes of this analysis due to the explosion in Passport activation and viewing. According to a recent CDP publication. As we noted on our blog, “March set all-time records in total streaming for the group of stations participating in our CDP Analytics Engine to track their members’ viewing habits and trends. April only continued these trends – participating stations saw a record 412,588 unique streamers stream a record 1.8 million hours of content. This included, also a record, 46,006 first-time streamers, a 25% increase from March’s previous record total”. These trends were evident in the Passport revenue with revenue up a median 52.4% in March 2020 vs March 2019 and up a whopping 81.9% in April. For the 4-month period, the large station median for Passport fundraising was $163,835 in Passport revenue followed by medium-sized stations at $52,985 and small stations at $17,600. Passport viewing behavior and associated revenue appears to have been the fundraising segment with the most direct impact to stay-at-home donors weathering the crisis.
Major Donors:
After a reasonably strong start to the year, revenue from major ($1,000+) donors were down a median 5.9% for 4-month period among the 122 stations in our analysis. Both TV and radio were down for the period but radio suffered more, down a median 8.2% compared to TV with a decrease of 6.4%. Given that we only looked at donors giving $1,000+ for the cumulative 4-month period, this trend could change with renewed efforts and communications aimed at informing major donors of their critical role during the crisis.
May Fundraising:

While the most recent National Reference File contains giving through April 2020, we can offer a glimpse into May fundraising by analyzing the results of MSB stations. We looked at 18 TV stations who have been with MSB for 1+ years to get some insight into the direction of fundraising. While March and most of April was relatively flat, MSB stations showed gains starting in the last week of April and continued into May with strong results. In this 5 week period, MSB stations reported impressive gains in 4 of the 5 weeks.
MSB vs Non-MSB Stations:

From the NRF, we took 17 MSB TV stations who have been live with MSB for 1+ years and looked at their performance against 62 Non-MSB TV stations of a comparable size distribution. We noted areas where the MSB stations differentiated themselves based on performance during March and April 2020, the first 2 months during which most non-profits felt the impact of the Coronavirus Crisis. We measured performance across fundraising segments based on the ROAR Source Category, applied universally across stations in the National Reference File (NRF).
1. March & April Revenue: Both the MSB station cohort and the non-MSB cohort experienced decreased revenue in March of 2020 but the impact was greater in the non-MSB cohort with station revenue down a median 2.5% compared to MSB station revenue which was down 1.3%. It was encouraging to find both cohorts returning to positive territory in April when both MSB and non-MSB stations reported an 8.1% increase. For the year, MSB stations are up a median 12.6% vs 5.8% for the non-MSB station cohort

2. Pledge Leads the Way: With $1 of every $3 in membership revenue coming from pledge, it is critical that stations continue to invest in pledge. After a strong start to the year, the MSB station cohort results reflected some belt-tightening in March with a median decrease of 2% compared to Non-MSB stations reporting a 6.6% decline. April results bounced back more significantly for MSB stations contributing to a median 11.3% increase for the year vs 10.6% decrease for non-MSB stations. The stark differences between MSB and non-MSB stations in March and April could be due to some non-MSB stations backing away from Pledge during the crisis.
3. Strong Digital Results: Many donors appear to have responded to crisis-related Digital messaging. Digital revenue, excluding Passport, was up by double digits in both March and April for both the MSB and non-MSB cohorts. While Digital revenue only makes up 7-8% of total membership revenue it is still notable that Digital revenue was up a median 41% across the 17 stations in the MSB cohort compared to 28% growth in the non-MSB cohort. Station’s ability to pivot messaging and quickly connect to donors during a crisis are critical differentiators for this fundraising segment.

4. Passport Revenue Offers a Bright Spot: With many families sheltering in place, Passport activation, acquisition and giving have increased considerably. MSB stations have fared better than non-MSB stations, increasing calendar year-to-date revenue by a median 56% compared to non-MSB stations at 51%. Solid gains in March and April combined with strong performance in January and February have contributed to these overall gains.